

In our previous blog post, we transform data from csv to parquet using AWS Glue then used Amazon Athena for analytics and used Quick Sight for data visualization. In this post we will walk you through all the features available in the Quick Sight and how to use them to build complex dashboards and make advance data visualizations to get some insights from the Airbnb Public Dataset.
First, we will learn about the data which is being used here for visualization. In the next steps we will load the data into spice engine and learn about the functionalities available in Quick Sight to create complex data visualization.
We will be able to visualize following insights from the data step by step using all functionalities of Quick Sight.
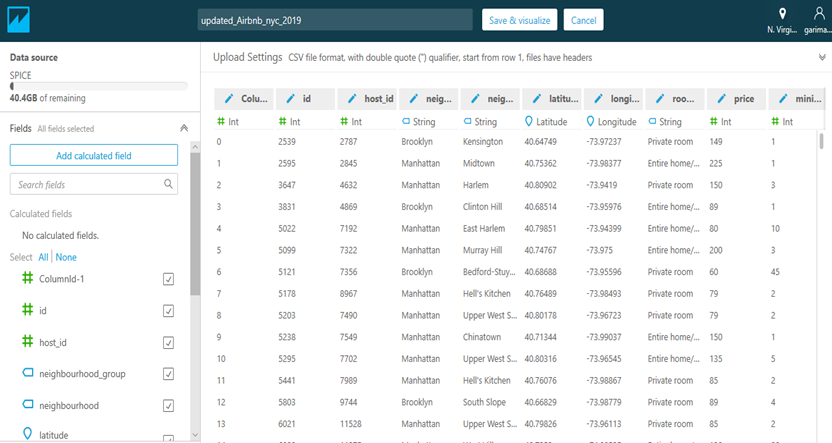
2) Loading the Dataset into Spice Engine for Visualization: We will import the data into Spice Engine for visualization.
3) Creating Visualization: We will start creating our visualization and we will be using all the functionalities available in Quick Sight one by one and apply them into given scenario.
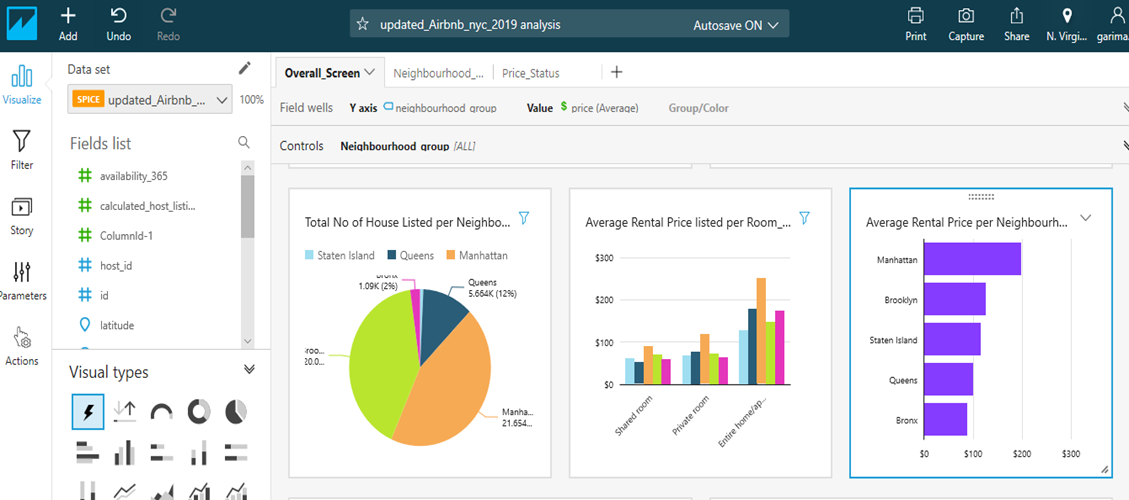
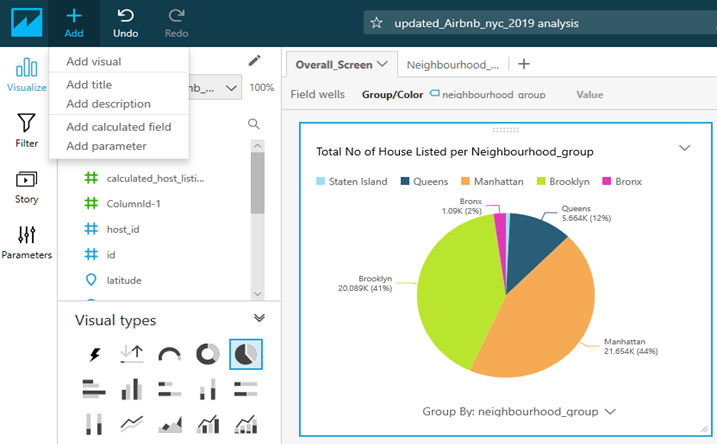
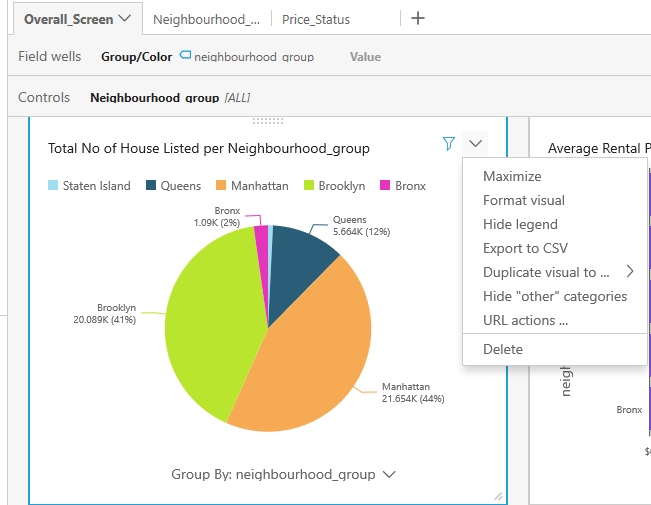
We can see all the features listed below:3a. Add a Visual: We can add visuals to create a chart or graph based on the requirement by clicking on Add on top of the window. In the given chart we are using Pie Chart which is showing Total No of House Listed per neighborhood group.
3b. Creating a Top and Bottom Filter: First we need to select the visual in which we want to apply the filter.
1. We will create a filter and applied that filter into one column which will filter the values. Here in this case we are taking host id column as a filtered column.
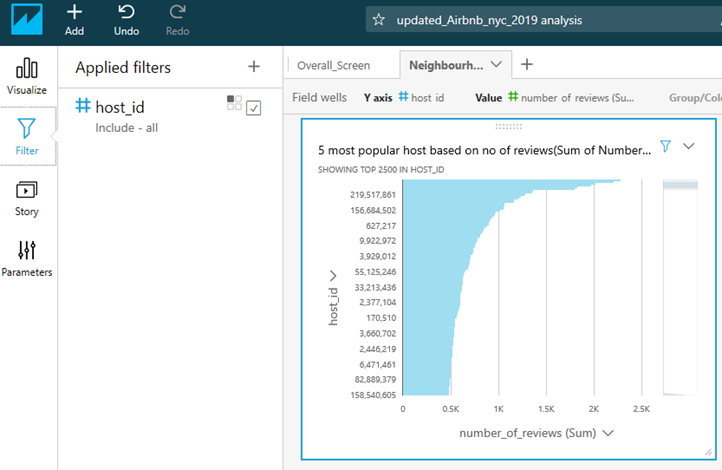
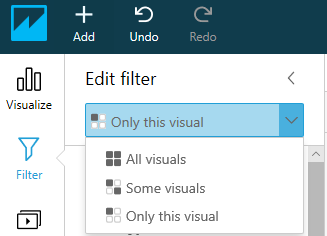
2. By clicking on the small square icon, we can edit filter and get an option to immune it from other visuals by choosing Only this visual option.
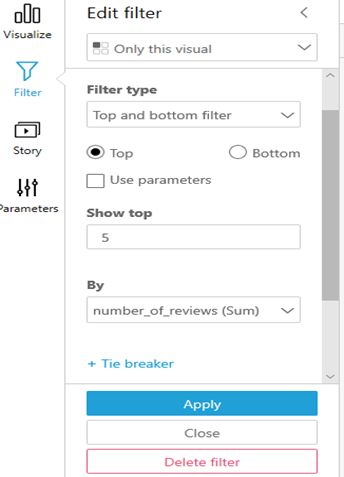
3. From the filter list we will choose Top and bottom filter From Show top we are not using any parameter to select the value so will type 5 and in By we will select number of reviews(sum) and Apply that filter.
As soon as we apply this filter to this visual, we can see that we are getting top 5 host id based on the number of reviews
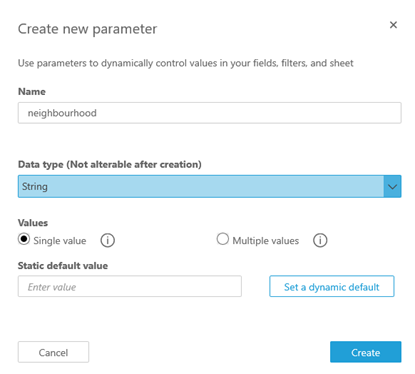
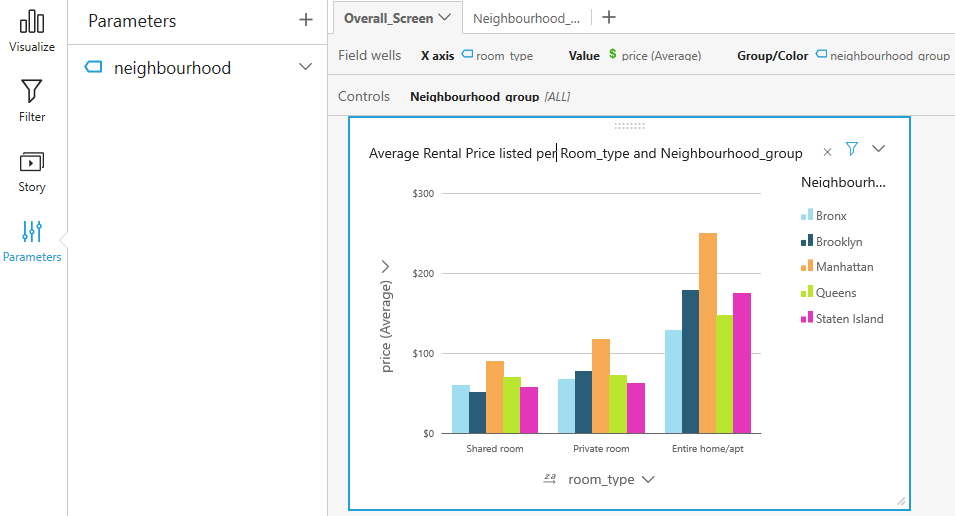
3c. Creating a Parameter and Control to Filter the Visuals: We can create a new parameter by choosing two options: Add parameter from top or create parameter from left pane. We will name it and choose the datatype of this parameter. Since we will be using this parameter for selecting the neighbourhood group so will choose string datatype. In Values we will choose Single value. In this case we will visualize Average Rental Price of House listed per Room type according to selected neighbourhood group which will be our control parameter.
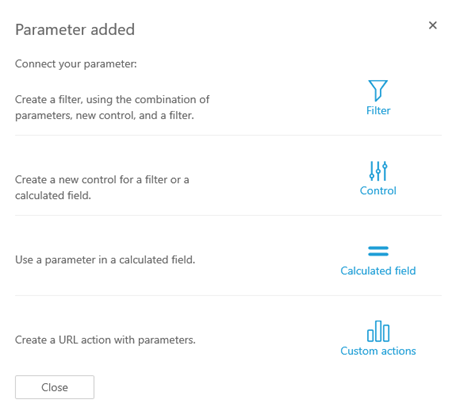
2. Once our parameter is created, we need to connect this parameter to control or filter or calculated field or URL action. In this case we are connecting it with control.
3. After selecting control, we need to add control for parameter where we have to choose neighbourhood group as Display name, choose Single select drop down in Style and Link to a data set field in Values then we will select our dataset and finally the column which will be used as a control parameter.
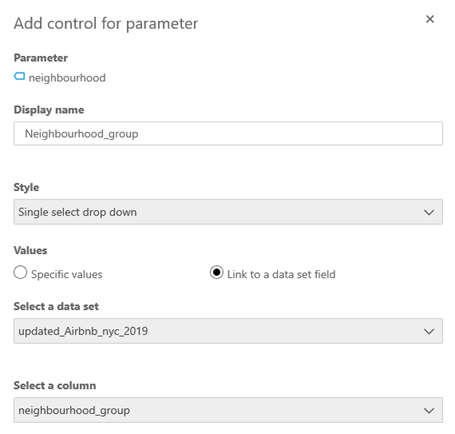
We have added a Control here named neighbourhood group which will be used for filtering the visual based on different neighbourhood groups. You can see here this Control is showing all the Values of neighbourhood group column.
4. In the visual you can see that before applying this control, this chart is showing Average Rental Price of Houses per Room_type for all the neighbourhood groups. If we want to see this chart only for Brooklyn or any other neighborhood group so we need to add filter to this control.
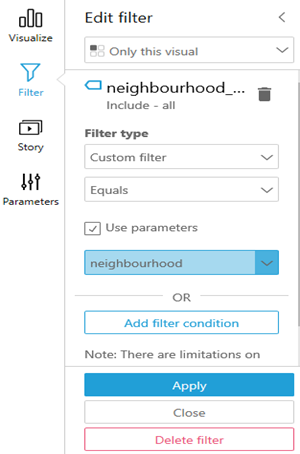
5. We will create a new filter and select Custom filter and Equals in Filter type, then Use parameter what we created earlier and Apply.
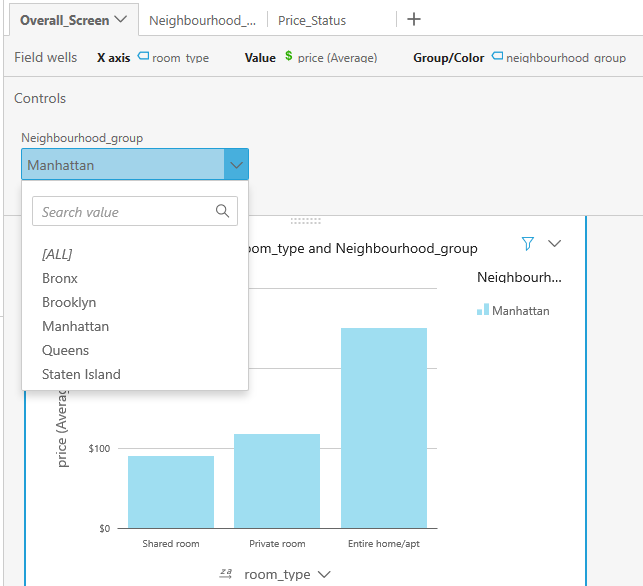
6. You can see here selecting Manhattan from the Control our Visual has been filtered and only showing values related to Manhattan.
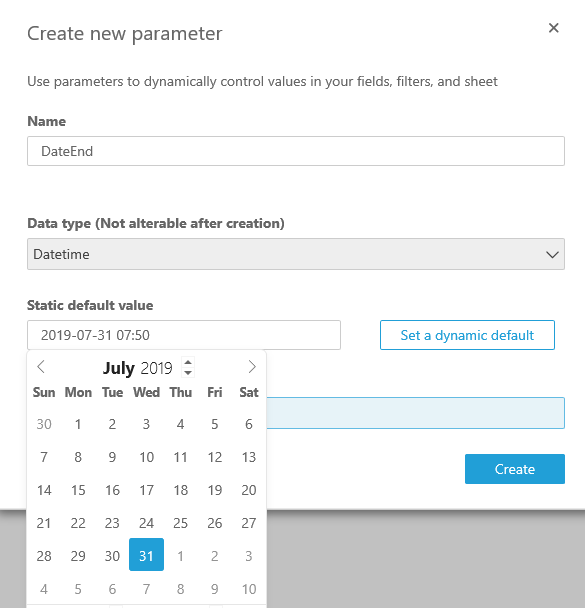
3d. Applying Date Range Filter to the Control: To filter the values for a visual between two given dates we need to create two parameter one for Start Date and other for End Date. In the following screen shot I am creating an End Date parameter same way you would be creating Start Date parameter.
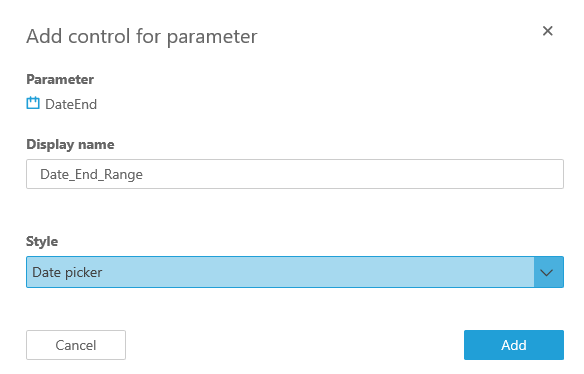
2. After creating parameters, we need to add controls for these two parameters.
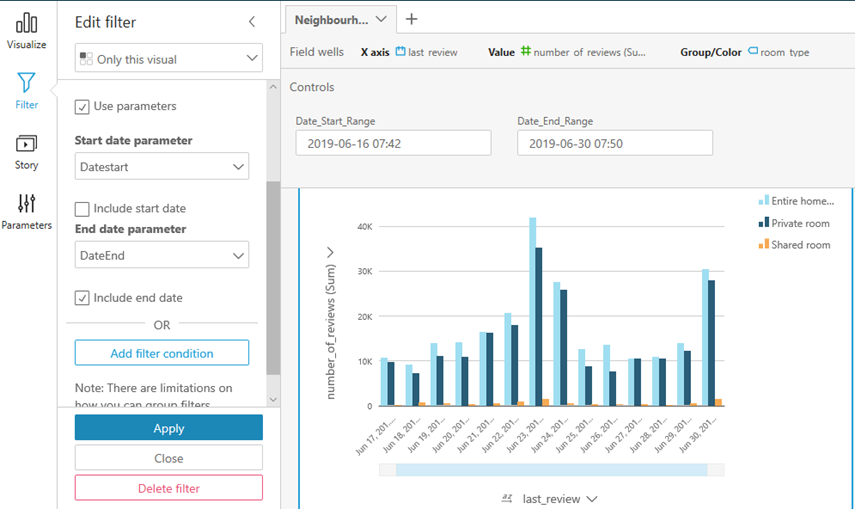
Once we are done with creating parameters and their respective controls, we need to add Time range filter which will use these two parameters to select the needed Data Range from the given Controls.
3. In the following screen shot you can see that Total number of reviews showing for date range from Jun 16 to Jun 30. I this chart you will see data for Jun 16 is not available as I have not marked on Include start date on left side pane and data for Jun 30 is available as I have marked Include end date.
3e. Adding a Calculated field: I have added a calculated field/column which will calculate the value of a new column based on your requirement and condition.
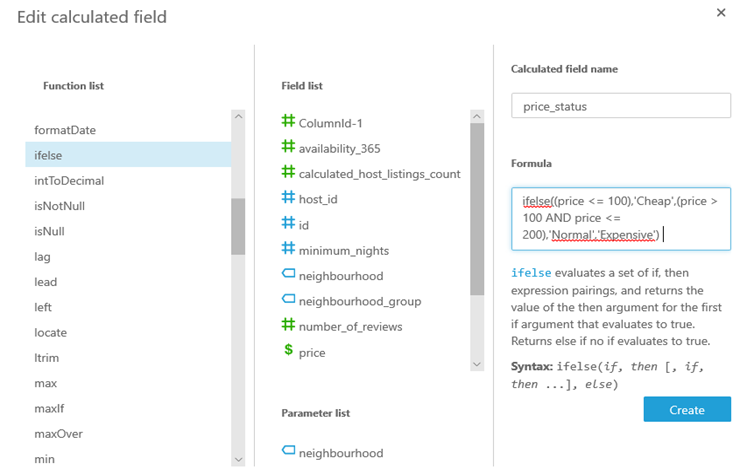
1. In this case I have created price status column which will categorize price values as Cheap/Normal/Expensive based on certain condition.
For creating a Calculated filed you need to choose Add calculated field option from Add. You will be redirected to the following page where you have option to write your Calculated field name and write Formula according to your requirement and condition.
You will also get option to use required functions from the Function list and required fields from Field list.
2. You can see in this visual I have used Pivot Table from the chart and choose host id, price status, neighbourhood group and room type fields as Rows and price(Average) as Values. which shows host id 2,845 have two types of rental houses/properties which are Shared room and Entire home/apt in Manhattan neighbourhood_group. You can clearly see that Shared room price is $99.00 which has been categorized as Cheap and Entire home/apt price is $225.00 which has been categorized as Expensive using our calculated field price status.

3f. Traversing from one screen to other or Drill Down to a Specific Field: We have an option to drill down to a specific field so that we can further analyze the data based on that specific field. In this case we have a Pie Chart of total no of house listed per neighbourhood group. Now we want to drill down our chart based on the field neighbourhood group which will take us to the screen where we can further explore new visualization based on selected neighbourhood group.
1. For that first we need to choose URL actions.
After choosing this URL actions it will take us to the following page where we have to write the action name followed by <
2. We will be using the same browser tab.
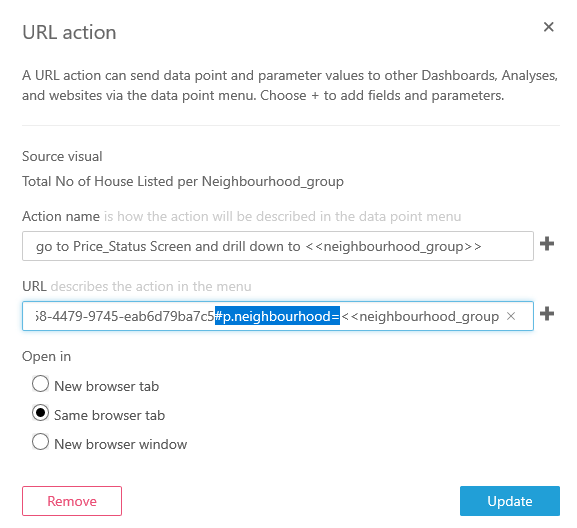
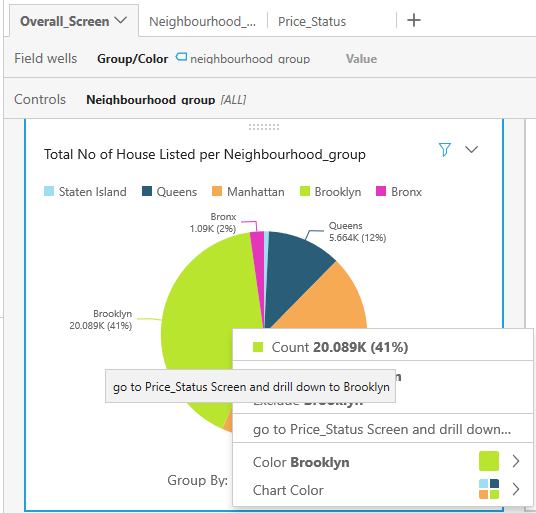
3. You can see here we are drilling down this chart based on neighbourhood group field. In this case we are drilling down to Brooklyn(just click on the chart in Brooklyn area) then you will see an option to go to Price Status Screen and drill down to Brooklyn. By clicking on this you will be redirected to the Price Status Screen and Chart/Visual presented in that screen will be filtered out by Brooklyn( You need to apply the filter in that screen where parameter name for filter control is neighbourhood). We will be using this parameter name in URL action as you already seen in previous screen shot.
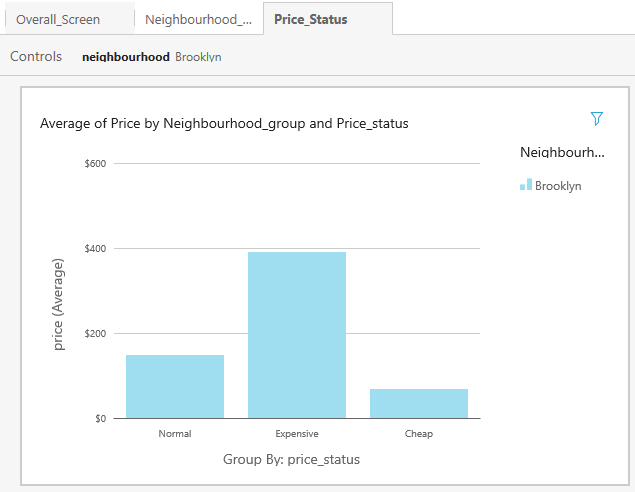
4. You can see here by drilling down to Brooklyn, Filter control in this Price Status Screen automatically select Brooklyn and based on that chart has been filtered by Brooklyn. In this chart you can see that Average Price for Expensive rental house is $380, Average price for Normal rental houses is $170 and Average price for Cheap rental house is $88.
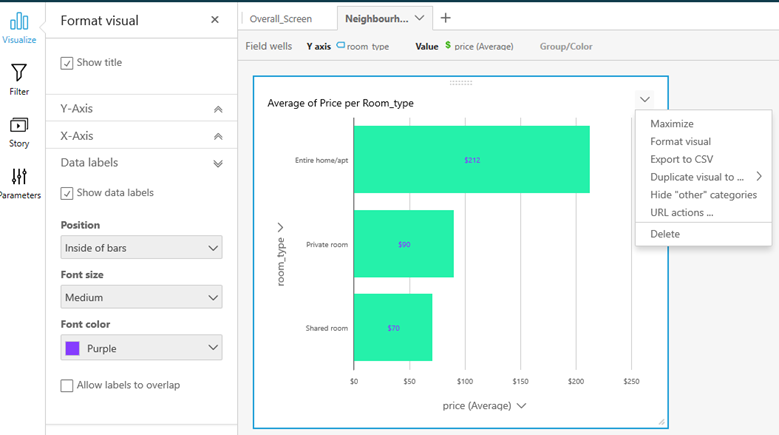
3g. Format each individual Visual: We can format our visuals by using this option. We can modify the X-Axis/Y-Axis labels, also we can show data labels and modify some of the parameters related to it. In this scenario we are using Horizontal bar chart which is showing Average Rental Price of house per Room type.
4) Summary: In this blog we are exploring Airbnb public dataset and discovering useful insights and showing them in visual form by using different functionalities of Quick Sight. Here we are learning how to apply filters with and without parameters. Apart from that we are exploring all the features available in the Quick Sight and usage of them. For more information on Quick Sight and Other Technical Services please check out our ITTStar Technology Blogs.